Unit testing tools using your MacOS terminal
I’ve been a MacOS user for many years and I’ve been working /suffering with Visual Studio for Mac and Mono Studio and let me say that their integrated tools to work with unit testing IMHO are not enough so I had to include new tools to make my work easy.
When I run my tests in a terminal window or in Visual Studio for Mac, the information they give me it’s only the final test result, i.e. how many tests are in red or how many tests are in green but I didn’t know which lines of code or which classes were covered by the unit testing.
dotnet test NBAStats.Core.Test.csproj

Starting test execution, please wait...

A total of 1 test files matched the specified pattern.

Test Run Successful.
Total tests: 11
     Passed: 11
 Total time: 1.4090 Seconds
It’s good but maybe it’s not enough so, how can we get more information about our unit testing? There are some tools that help us to get more information like:
Coverlet
Coverlet is a cross platform code coverage framework for .NET, with support for line, branch and method coverage. It works with .NET Framework on Windows and .NET Core on all supported platforms.
https://github.com/tonerdo/coverlet
It has different integrations with VsTest, MSBuild and dotnet global tool but let me show you only the MSBuild one. To use it, we have to add the coverlet.msbuild nuget package in our test project and after that we can run the unit test collecting code coverage data (/p:CollectCoverage=true).
dotnet test NBAStats.Core.Test.csproj /p:CollectCoverage=true

Starting test execution, please wait...

A total of 1 test files matched the specified pattern.

Test Run Successful.
Total tests: 11
     Passed: 11
 Total time: 1.4193 Seconds

Calculating coverage result...

+---------------+--------+--------+--------+
| Module        | Line   | Branch | Method |
+---------------+--------+--------+--------+
| NBAStats.Core | 20.44% | 14.78% | 20.12% |
+---------------+--------+--------+--------+

+---------+--------+--------+--------+
|         | Line   | Branch | Method |
+---------+--------+--------+--------+
| Total   | 20.44% | 14.78% | 20.12% |
+---------+--------+--------+--------+
| Average | 20.44% | 14.78% | 20.12% |
+---------+--------+--------+--------+
As you can see the last lines are regarding with the code coverage calculation. Please take into account the 20%, it’s only a demo.
Coverlet has multiple interesting options but my two favorites are:
Setup the output format because it’s compatible with:
- json (default one)
- lcov
- opencover
- cobertura
So if we want to create a report with the opencover format in the directory ../coverage/ we should execute:
dotnet test NBAStats.Core.Test.csproj
  /p:CollectCoverage=true
  /p:CoverletOutput=../coverage/
  /p:CoverletOutputFormat=opencover

Starting test execution, please wait...
.
.
.
Calculating coverage result...
  Generating report '../coverage/coverage.opencover.xml'
In my case, I don’t usually want to check the code coverage in my Views (xaml files because I’m a Xamarin Forms developer) so I exclude all files (xaml/ xaml.cs) in the Views namespace.
dotnet test NBAStats.Core.Test.csproj
  /p:CollectCoverage=true
  /p:CoverletOutput=../coverage/
  /p:CoverletOutputFormat=opencover
  /p:Exclude="[*]*.Views.*"
ReportGenerator
ReportGenerator converts coverage reports generated by Coverlet, OpenCover, dotCover, Visual Studio, NCover, Cobertura, JaCoCo, Clover, gcov or lcov into human readable reports in various formats.
https://github.com/danielpalme/ReportGenerator
Depends on our platform and needs, we have to install a different package, in this case, I’m going to use the dotnet global tool.
dotnet tool install -g dotnet-reportgenerator-globaltool
So, if we want to export our previous opencover report in HTMLInline format we should execute:
reportgenerator "-reports:src/coverage/*.xml" "-reporttypes:HTMLInline" "-targetdir:src/coverage/report"

2019-10-20T15:31:27: Arguments
2019-10-20T15:31:27:  -reports:src/coverage/*.xml
2019-10-20T15:31:27:  -reporttypes:HTMLInline
2019-10-20T15:31:27:  -targetdir:src/coverage/report

2019-10-20T15:31:27: Executable: /Users/mookiefumi/.dotnet/tools/.store/dotnet-reportgenerator-globaltool/4.3.1/dotnet-reportgenerator-globaltool/4.3.1/tools/netcoreapp3.0/any/ReportGenerator.Core.dll
2019-10-20T15:31:27: Working directory: /Users/mookiefumi/temp/NBAStats
2019-10-20T15:31:27: Loading report '/Users/mookiefumi/temp/NBAStats/src/coverage/coverage.opencover.xml' 1/1 in memory
2019-10-20T15:31:27: Finished parsing /Users/mookiefumi/temp/NBAStats/src/coverage/coverage.opencover.xml...
2019-10-20T15:31:27: Parsing of 1 files completed.
2019-10-20T15:31:27: Start merge result 1
2019-10-20T15:31:27: Finished merge result 1
2019-10-20T15:31:27: Initializing report builders for report types: HTMLInline
2019-10-20T15:31:27: Analyzing 30 classes
2019-10-20T15:31:27:   Writing report file 'src/coverage/report/index.htm'
2019-10-20T15:31:27: Report generation took 0.2 seconds
If you open the generated htm file (src/coverage/report/index.htm’) you can see a summary of the code coverage and you can click on every namespace or class to navigate to the detail.
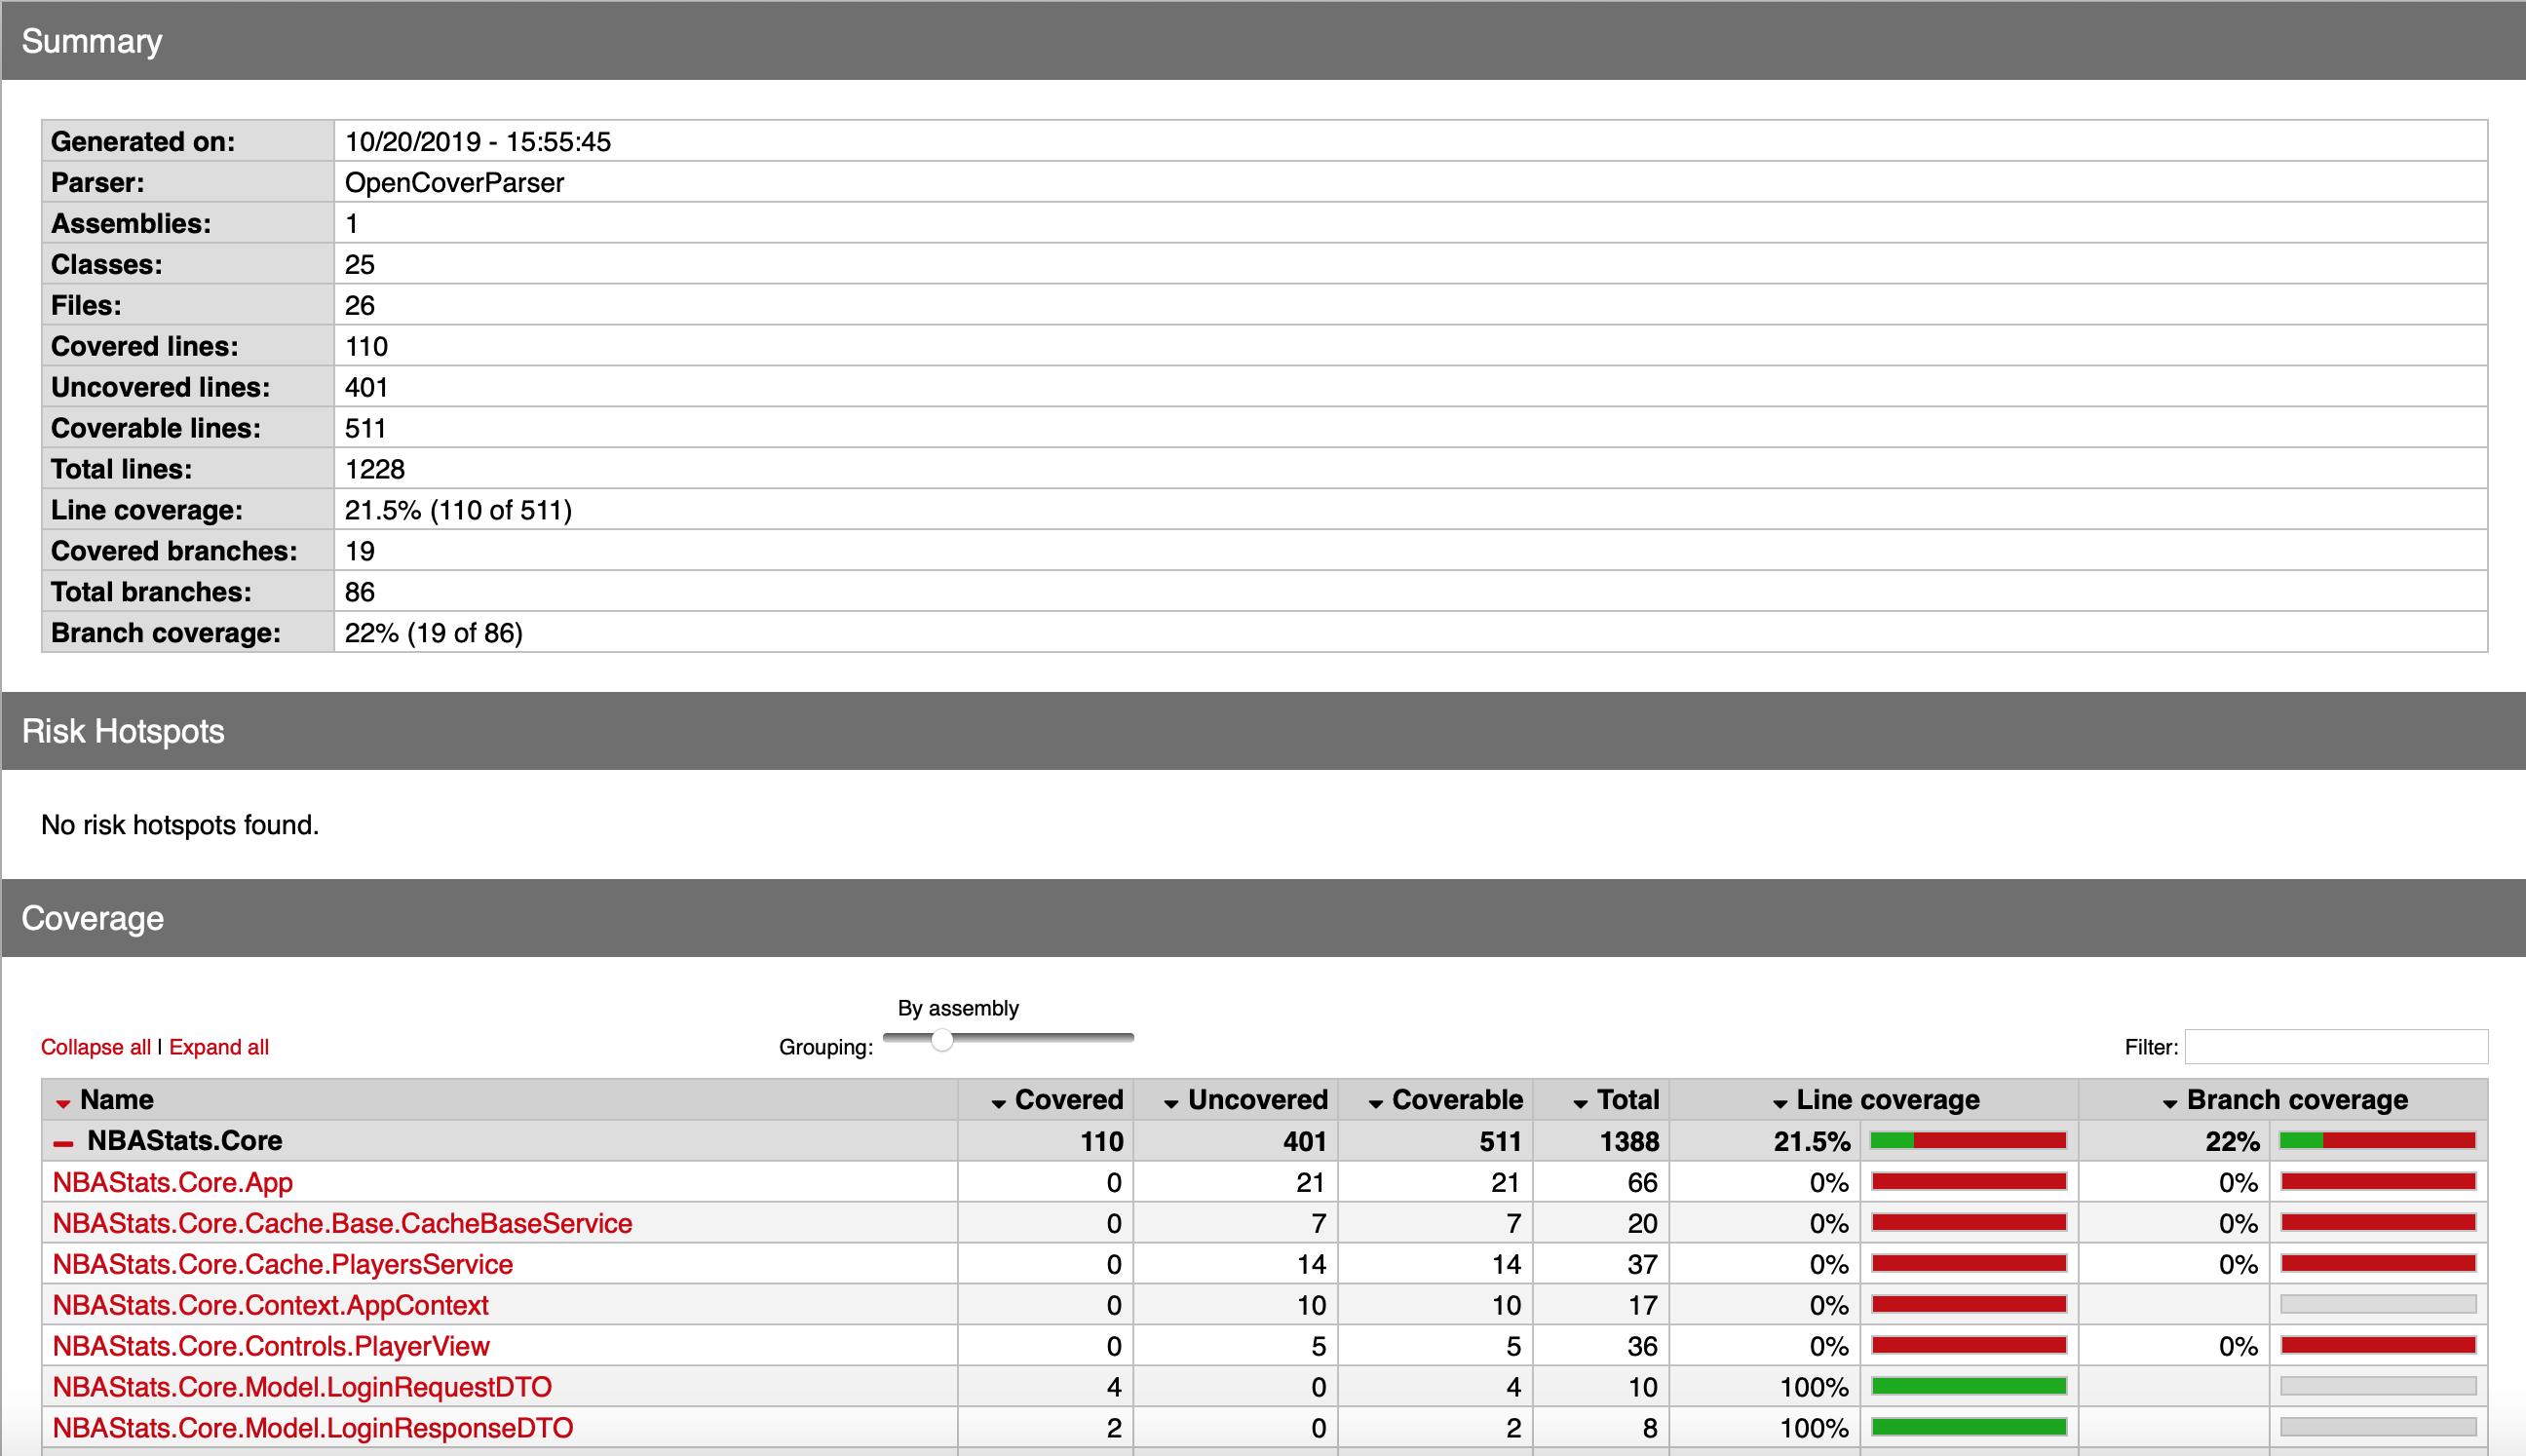
Nice!